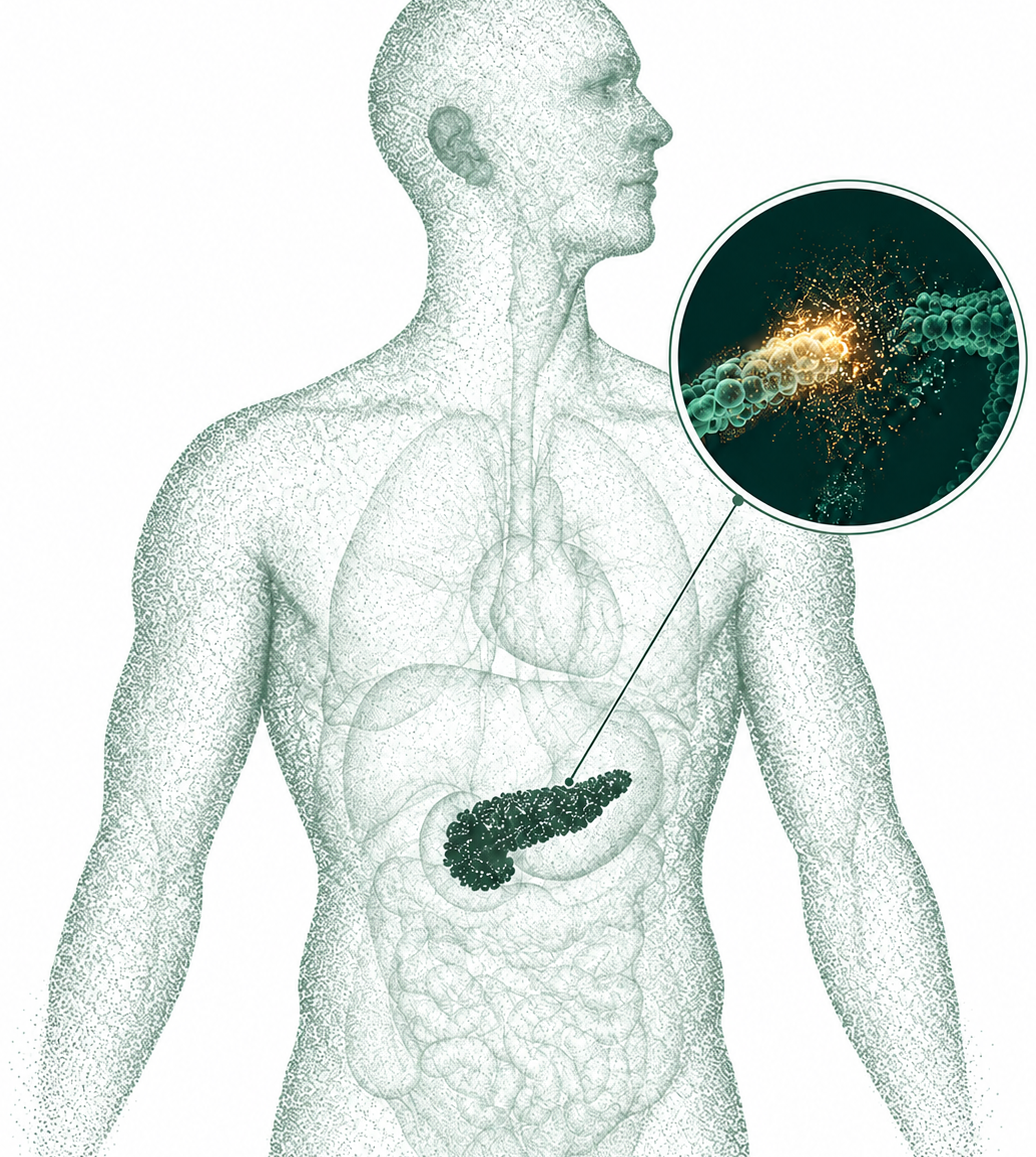

Global prevalence
589M
Adults living with diabetes worldwide
A global health crisis affecting every region and population.
IDF Diabetes Atlas, 2024
Kihealth Series A investor presentation
Kihealth is developing a molecular-intelligence platform designed to measure active cellular injury, support earlier biological understanding and enable disease interception.
 Originated at Yale University
 ADA Innovation of the Year — 2025
 CLIA/COLA-certified laboratory infrastructure

01/37
02 / 37
The investment thesis
Kihealth translates tissue-specific signals of active cellular injury into real-time biological intelligence, beginning with beta-cell injury in diabetes and expanding into a multi-indication platform for clinical care and therapeutic development.
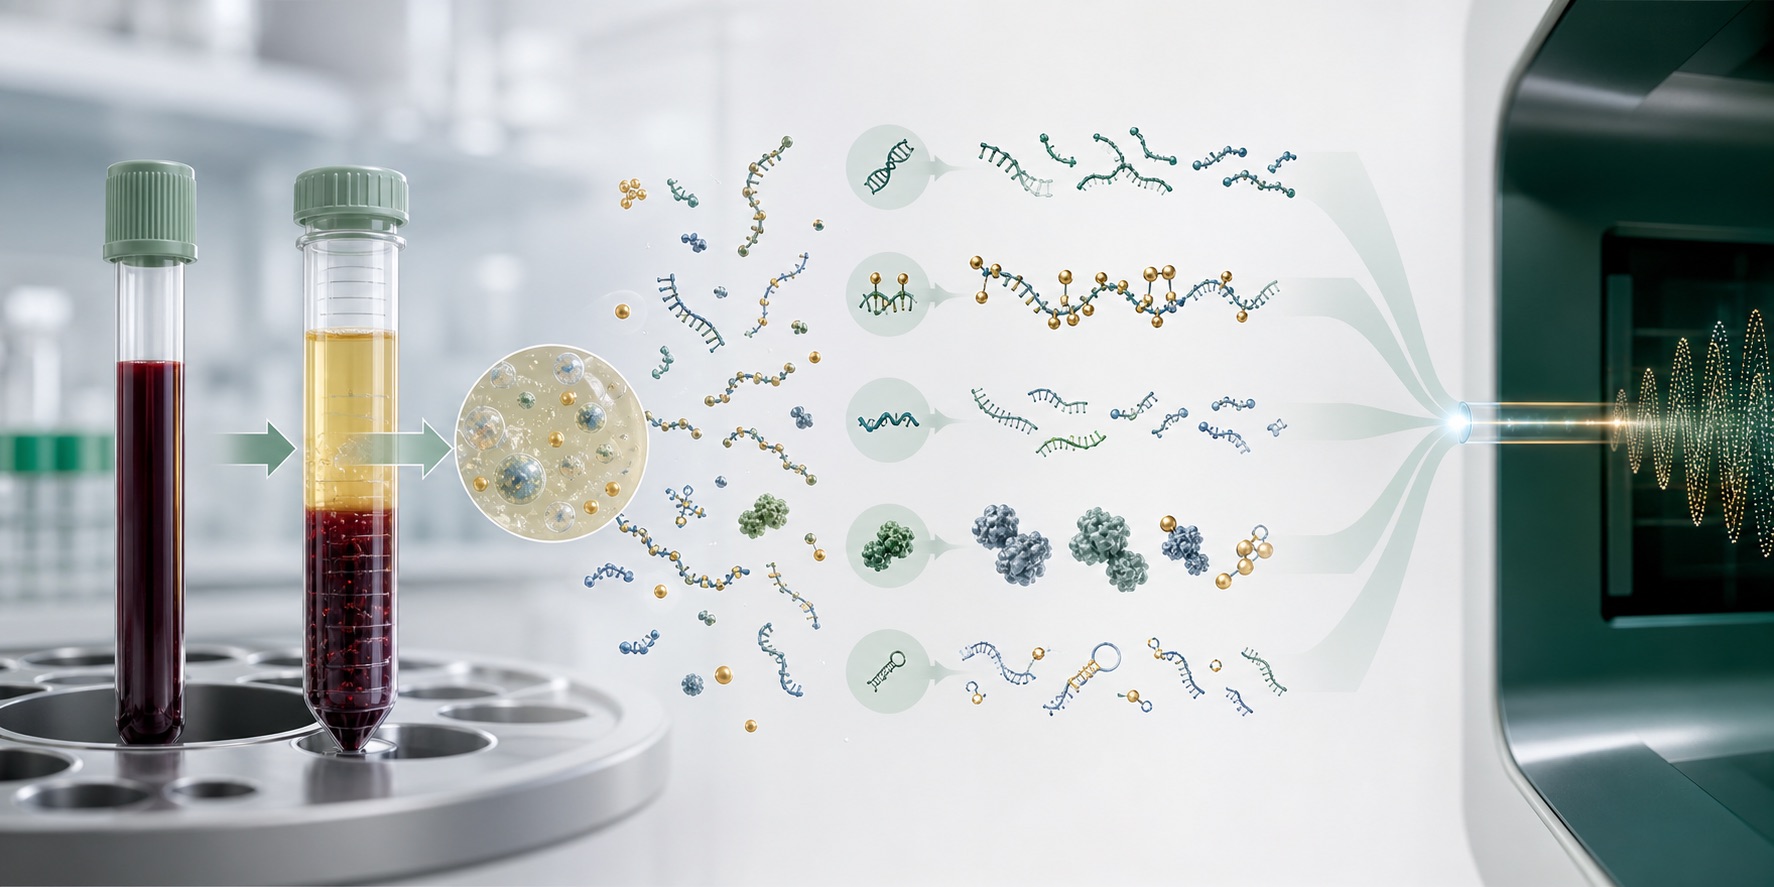
From a standard blood draw to biological intelligence
01 · Detect
Tissue-specific injury
02 · Quantify
Molecular signal
03 · Act
Clinical intelligence
01 — Differentiated biological signal
Beta Intercept is designed to measure active, tissue-specific cellular injury, not simply disease risk, remaining function or downstream metabolic consequences.
02 — Focused clinical entry point
Beta Intercept provides a focused initial application for earlier T1D & T2D detection, therapeutic monitoring, patient stratification and pharmaceutical development.
03 — Multiple commercial pathways
Revenue pathways include clinical testing, pharmaceutical study services, therapeutic-response monitoring and companion-diagnostic partnerships.
04 — Scalable platform architecture
The molecular-intelligence approach can extend into additional metabolic, oncologic, autoimmune and neurodegenerative indications.
Foundation in place
One platform combines validated biology, operational infrastructure, reimbursement progress, defensible IP, clinical evidence and early commercial traction.
CLIA/COLA-certified lab
Operational infrastructure
Fully validated LDT
Launch-ready lead assay
5+ studies
Clinical evidence engine
Existing revenue
Early commercial proof
Active PLA code
Reimbursement pathway
Issued + pending IP
Defensible platform position
The round
$15M Series A
03 / 37
The problem
Current diagnostic tools frequently measure downstream consequences of disease rather than the active biological injury driving it.
01
May identify risk, but do not directly quantify active beta-cell death.
02
Reflect metabolic consequences after biological injury has progressed.
03
Measures remaining function rather than the real-time rate of cellular loss.
04
Meaningful beta-cell function may already have been lost.
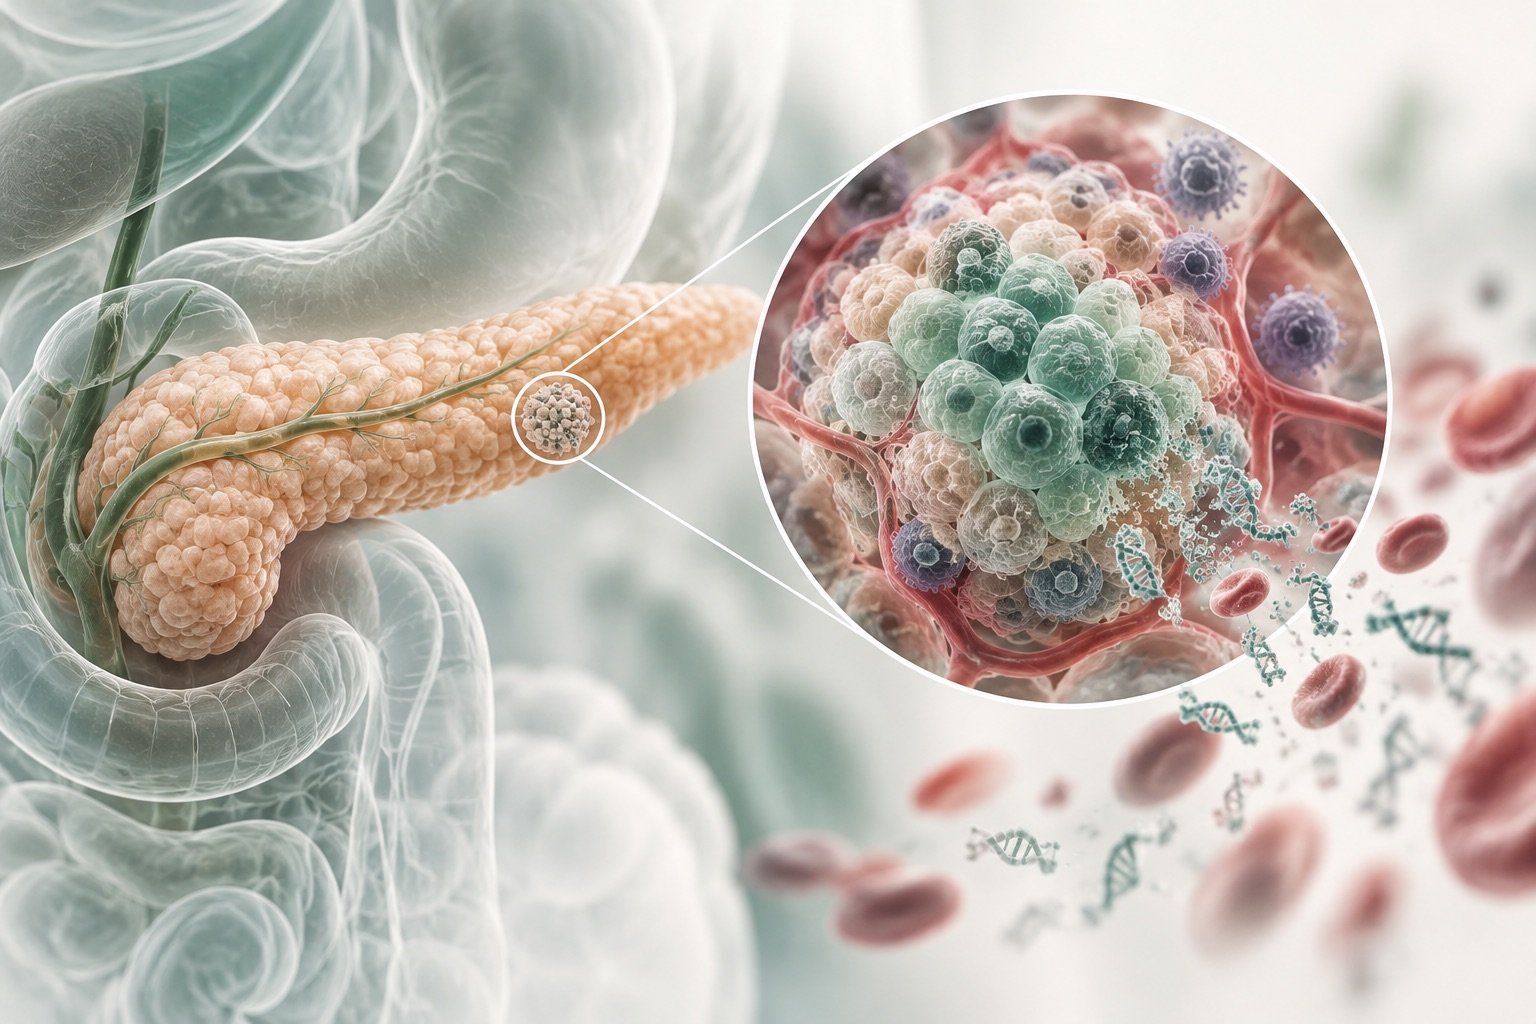
The diagnostic gap
The biological signal exists before the symptoms.
50–70%
of beta-cell function is already lost at clinical diagnosis. In children presenting with DKA, over 80%.
$327B
Annual U.S. diabetes spend — most of it treating complications earlier detection could have prevented.
As diabetes care moves toward earlier intervention and increasingly sophisticated metabolic therapies, the value of measuring active disease biology increases.
The problem is not a lack of data.
It is a lack of direct biological visibility.
04 / 37
Global impact
Global prevalence
589M
Adults living with diabetes worldwide
A global health crisis affecting every region and population.
IDF Diabetes Atlas, 2024
Projection
853M
Projected to have diabetes by 2050
Without more effective prevention and earlier detection, prevalence will continue to rise.
IDF Diabetes Atlas, 2024
Economic burden
$1T+
Global annual diabetes-related health expenditure
The economic weight of late-stage disease continues to climb.
IDF / WHO
United States
98M
American adults with prediabetes
More than one in three adults is at increased risk for Type 2 diabetes.
CDC
Awareness gap
81%
Of adults with prediabetes are unaware
Silent progression can continue for years without clinical recognition.
CDC
Population at risk
1 in 3
U.S. adults have prediabetes
A third of the adult population sits inside the window where earlier detection matters most.
CDC
05 / 37
THE MEASUREMENT GAP
Kihealth detects active beta-cell destruction long before clinical symptoms emerge.
A tissue-specific signal creates a window to identify active disease biology while beta-cell mass may still be salvageable.
Biological visibility
The signal exists before standard diagnosis can see it.
625
days earlier, up to
Stage 1
Autoimmune attack begins (T1D)
01Stage 2
Beta-cell death starts
02Stage 3
Compensation failing
03Stage 4
Blood glucose rising
04Stage 5
Symptoms appear
05Window of opportunity
Standard diagnosis
For patients
Earlier detection enables earlier enrollment in disease-modifying therapy, when beta-cell mass is still salvageable and treatment has maximum impact.
For pharma
Kihealth’s signal can serve as a pharmacodynamic endpoint, showing drug effect weeks before C-peptide or HbA1c changes are detectable.
06 / 37
THE MISSING GAP
Established tests reveal different dimensions of diabetes. Beta Intercept is designed to add a molecular view of active beta-cell injury and death.
HbA1c
Average glucose exposure over recent months
Glucose / CGM
Current glucose levels and daily patterns
Autoantibodies
Evidence of autoimmunity and associated disease risk
C-peptide
How much insulin the body is producing
Beta Intercept™
Designed to detect beta-cell active injury and cell death. The earliest sign of disease onset.
The missing dimension
Each established test answers a different question. None measures active beta-cell injury itself, the signal closest to the disease process.
The opportunity
Understand disease activity over time
Through repeated testing, Beta Intercept aims to help clinicians:
Detect active injury
Identify a molecular signal of ongoing beta-cell damage.
Track its course
Measure whether the injury signal is increasing, stable, or declining.
Understand progression
Help distinguish progressors from non-progressors and assess how quickly disease is advancing.
Inform intervention
Add biological context to disease staging, treatment timing, and therapeutic selection.
07 / 37
The Kihealth solution
A tissue-specific, multi-omic platform that combines molecular measurements with clinical context to reveal disease biology and support earlier intervention.
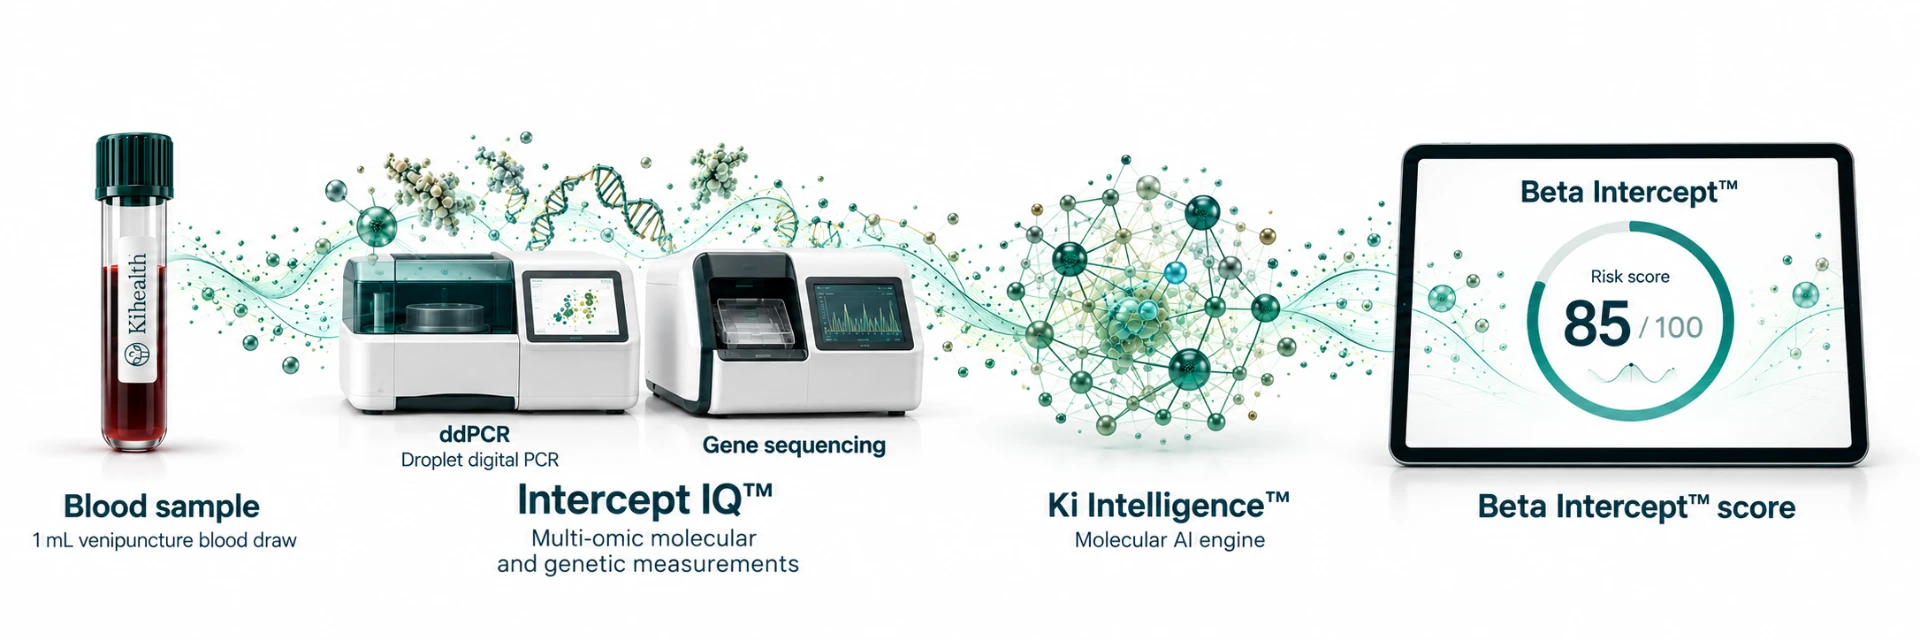
01
Analyze tissue-specific cell-free DNA and complementary biomarkers in blood.
02
Determine which tissue the signal comes from, providing insight into cellular injury and disease activity.
03
Ki Intelligence™, our molecular AI engine, is designed to integrate these signals with clinical and longitudinal data to generate predictive models and disease-risk scores.
One platform connecting molecular detection with the opportunity for disease prevention.
08 / 37
OUR FIRST PRODUCT
An earlier window into diabetes. A greater opportunity to intervene.
A breakthrough blood-test approach designed to reveal active beta-cell injury and death, bringing the underlying disease process into view before clinical symptoms emerge.
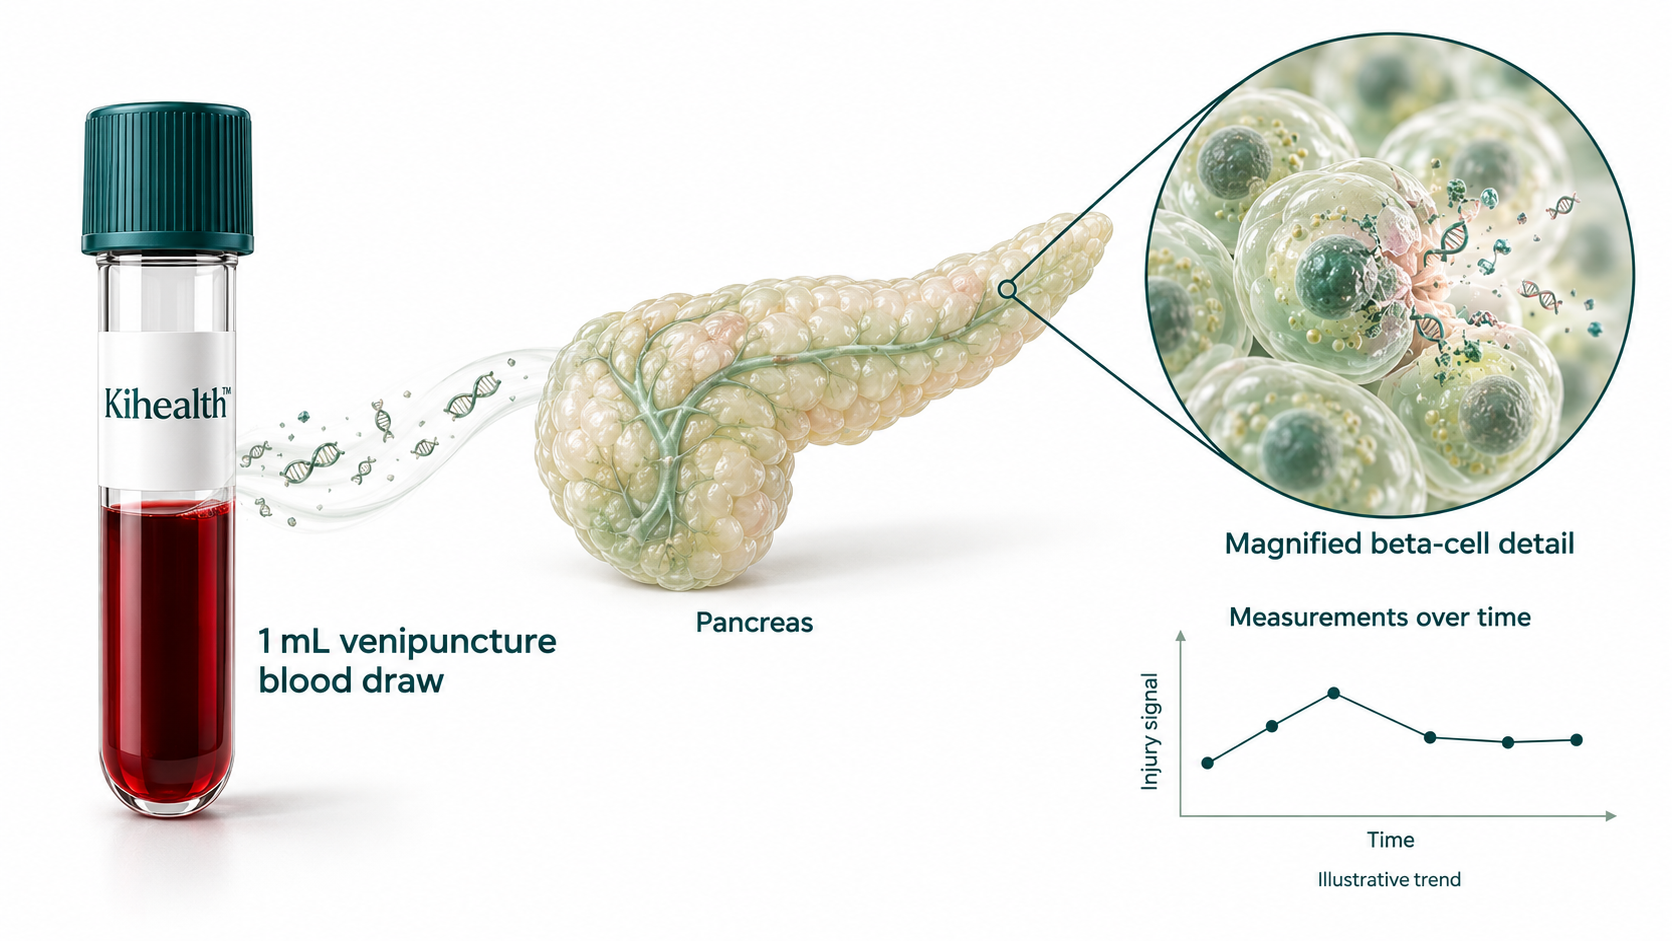
Molecular evidence of injury could identify patients who need attention sooner, while insulin-producing function remains to be preserved.
Adds a critical dimension to established diabetes testing: evidence of ongoing cellular injury and how that signal changes over time. The opportunity is more informed monitoring and better-timed intervention.
Repeated measurements can help identify biologically active patient populations and evaluate whether treatments change beta-cell injury, supporting trials of therapies intended to preserve function.
IMPACT
Make the window for earlier intervention visible, and help evaluate the therapies that could change what happens next.
09 / 37
TWO PRODUCTS. ONE PLATFORM.
Shared molecular and genetic measurements, connected to Ki Intelligence™ molecular AI.
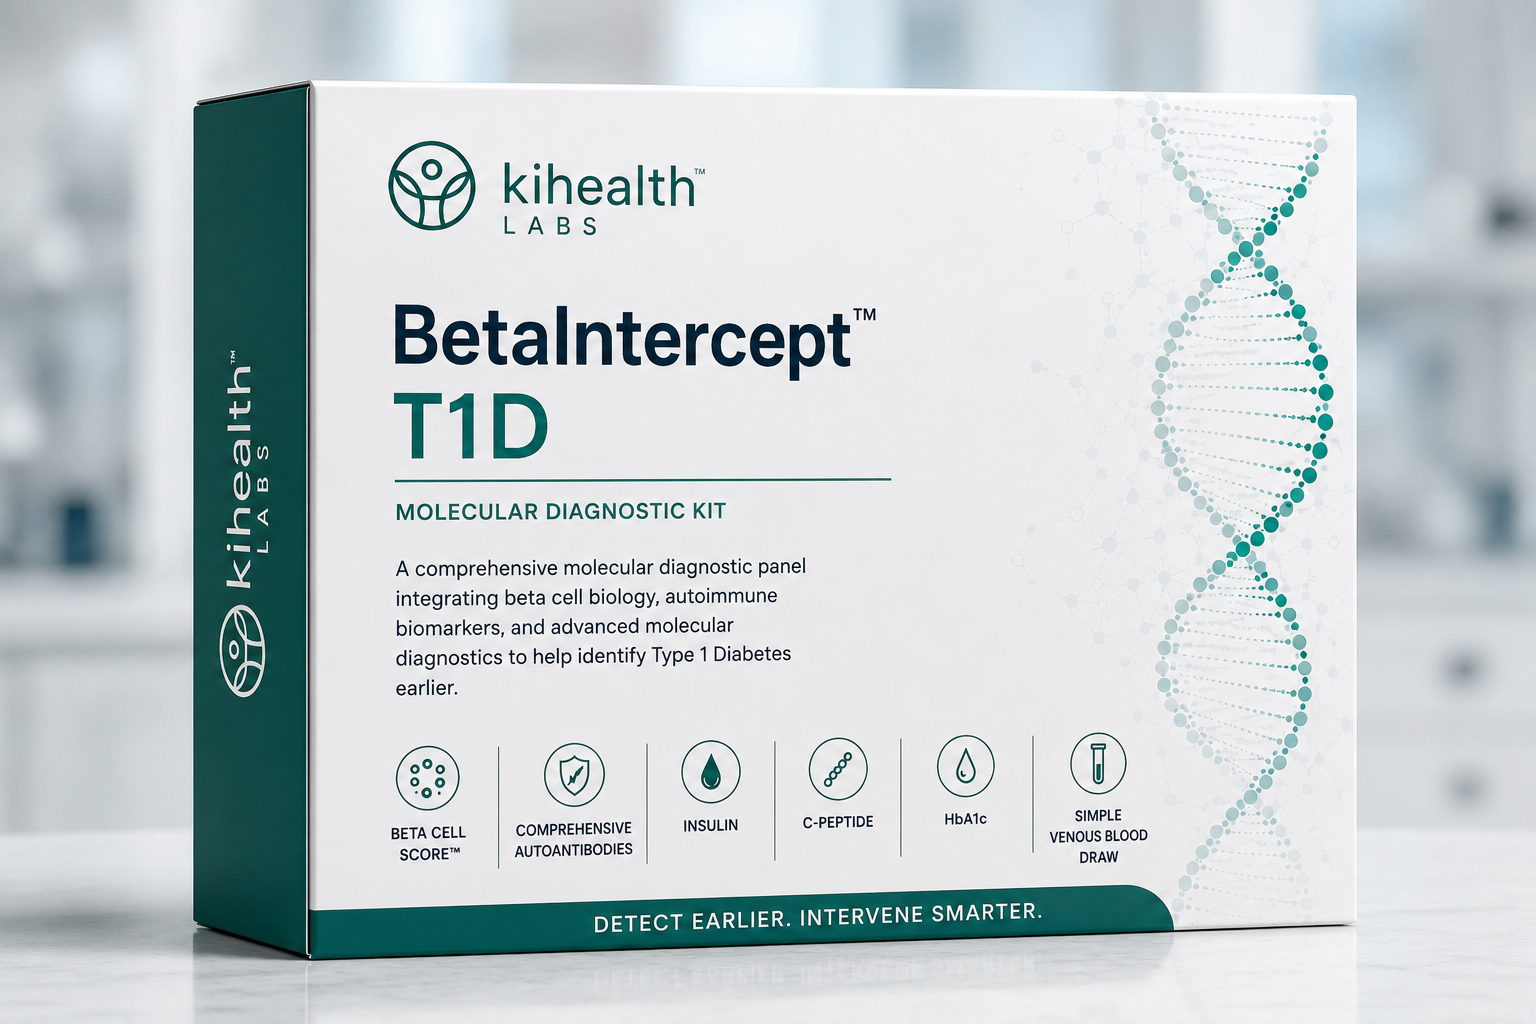
Autoimmune beta-cell injury and loss
9.5M+
people worldwide live with Type 1 diabetes, across all ages.IDF
Designed for
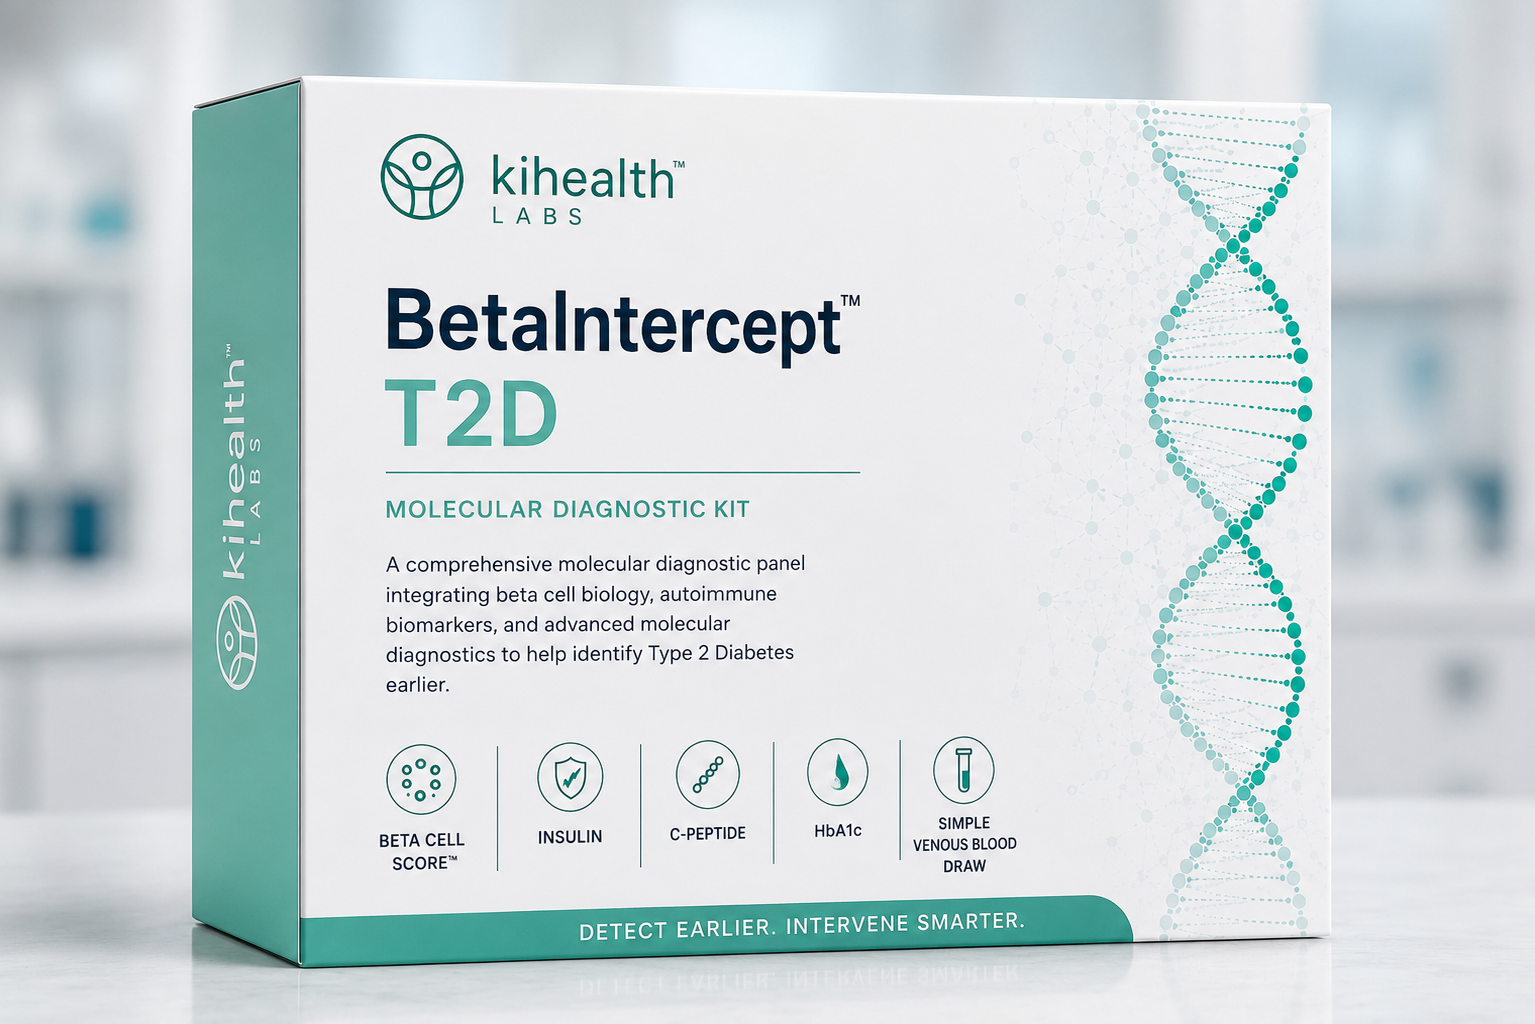
Metabolic beta-cell injury and dysfunction
634M+
more than 634 million adults worldwide are estimated to have impaired glucose tolerance (prediabetes).*
Designed for
Commercial opportunityInitial testing, repeat monitoring, and biopharma partnerships across two distinct disease markets.
10 / 37
Why now
Earlier identification and disease-modifying therapies are creating a new imperative: identify who needs intervention, and measure whether it is working.
A massive opportunity before diabetes develops. ADA 2026 supports presymptomatic screening in elevated-risk populations, identifying disease activity before clinical diagnosis.
Type 1 diabetes
30–40%
of U.S. children newly diagnosed with T1D already have diabetic ketoacidosis.
Type 2 diabetes
115.2M
U.S. adults living with prediabetes
8 in 10
Do not know they have it
The Kihealth opportunity
Identify who is actively progressing and who could benefit from intervention before further loss of insulin-producing capacity.
Therapies are demonstrating the ability to delay diabetes progression. The opportunity is to identify patients who could benefit before further loss of insulin-producing capacity.
2×
Longer to clinical T1D
Tzield extended median time to Stage 3 diagnosis to 50 months versus 25 months.
93%
Lower risk of progression to T2D
Tirzepatide reduced progression risk over 176 weeks in participants with obesity and prediabetes.
The Kihealth opportunity
Reveal beta-cell injury earlier, helping identify potential treatment candidates, inform intervention timing and assess biological response.
Billions in therapies. A growing opportunity for biological insight, every new therapy depends on knowing who to treat, and whether it is working.
Goldman Sachs Research
$114B
Projected global obesity-drug sales by 2030
J.P. Morgan
$200B
Projected global incretin market by 2030
The Kihealth opportunity
Identify candidates earlier. Inform treatment selection. Track biological response.
More competing therapies raise the bar for evidence. Developers need answers to five critical questions:
Efficacy — How much benefit does the therapy deliver?
Patient selection — Which patients are most likely to benefit?
Durability — How long does the benefit last?
Biological response — What changes beneath the clinical outcome?
Differentiation — What evidence distinguishes this therapy from alternatives?
The Kihealth opportunity
Help developers connect treatment to biological response, and build stronger evidence across the therapeutic lifecycle.
The therapeutic revolution now requires a corresponding measurement revolution.
11 / 37
One platform. Many applications.
Intercept IQ™ generates biological intelligence across prevention, clinical care, therapeutic innovation, and population health.

Identify metabolic risk earlier across communities and systems.

Stratify and monitor patient populations for therapeutic development.
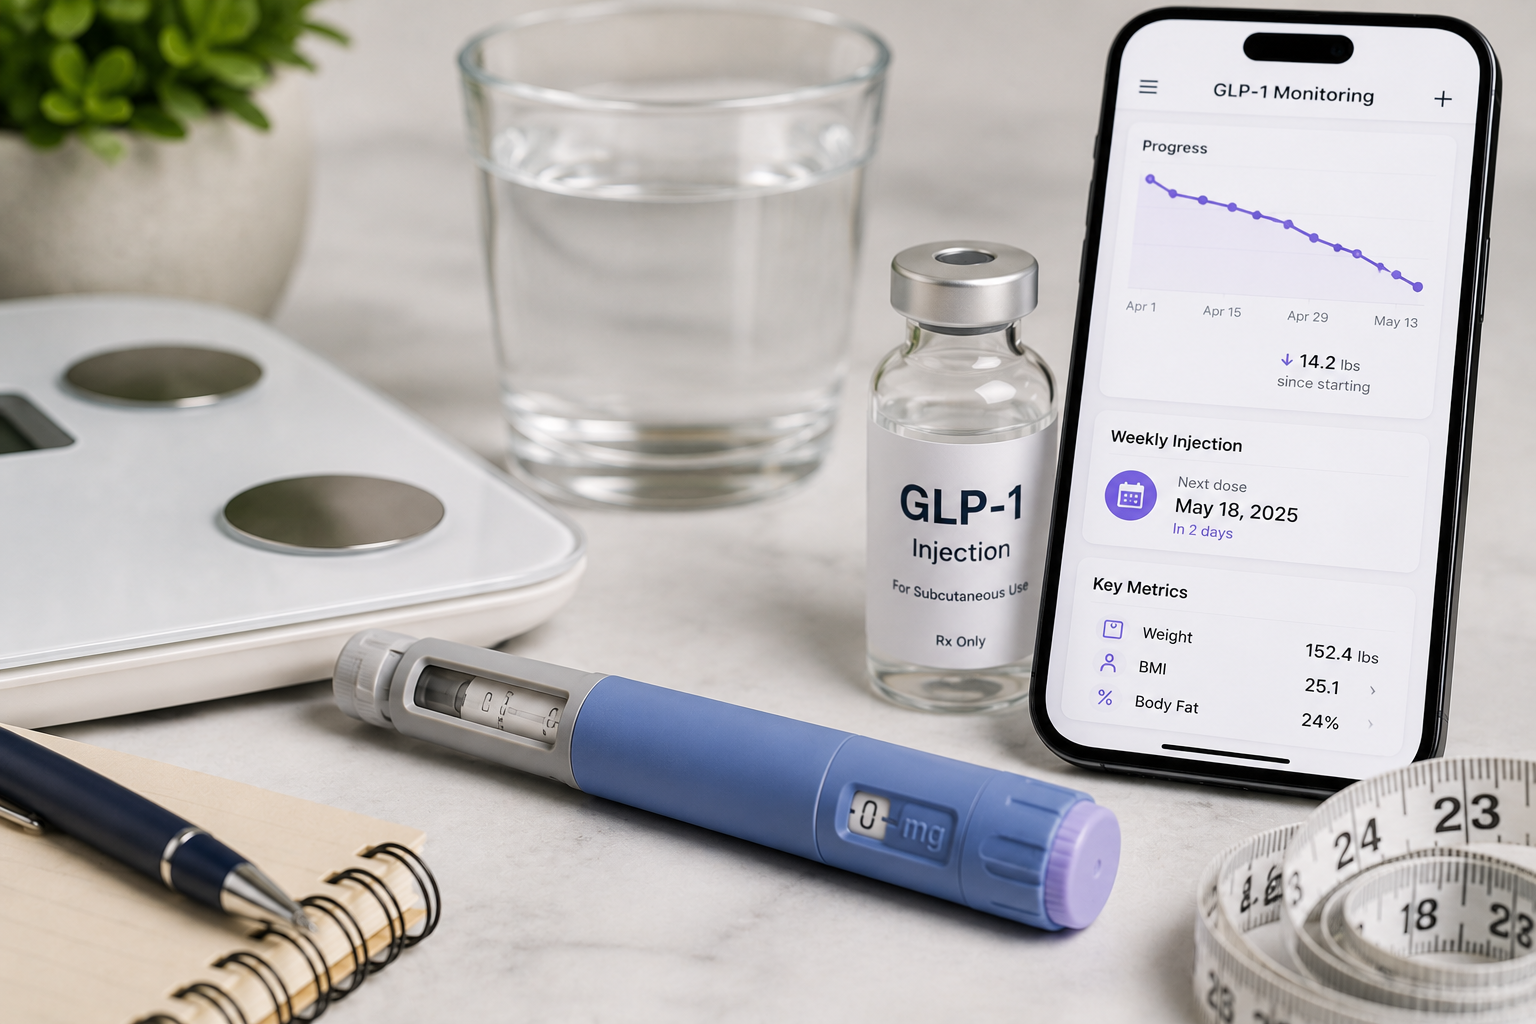
Quantify biological response to GLP-1 and metabolic therapies.

Evaluate metabolic health through a root-cause clinical lens.
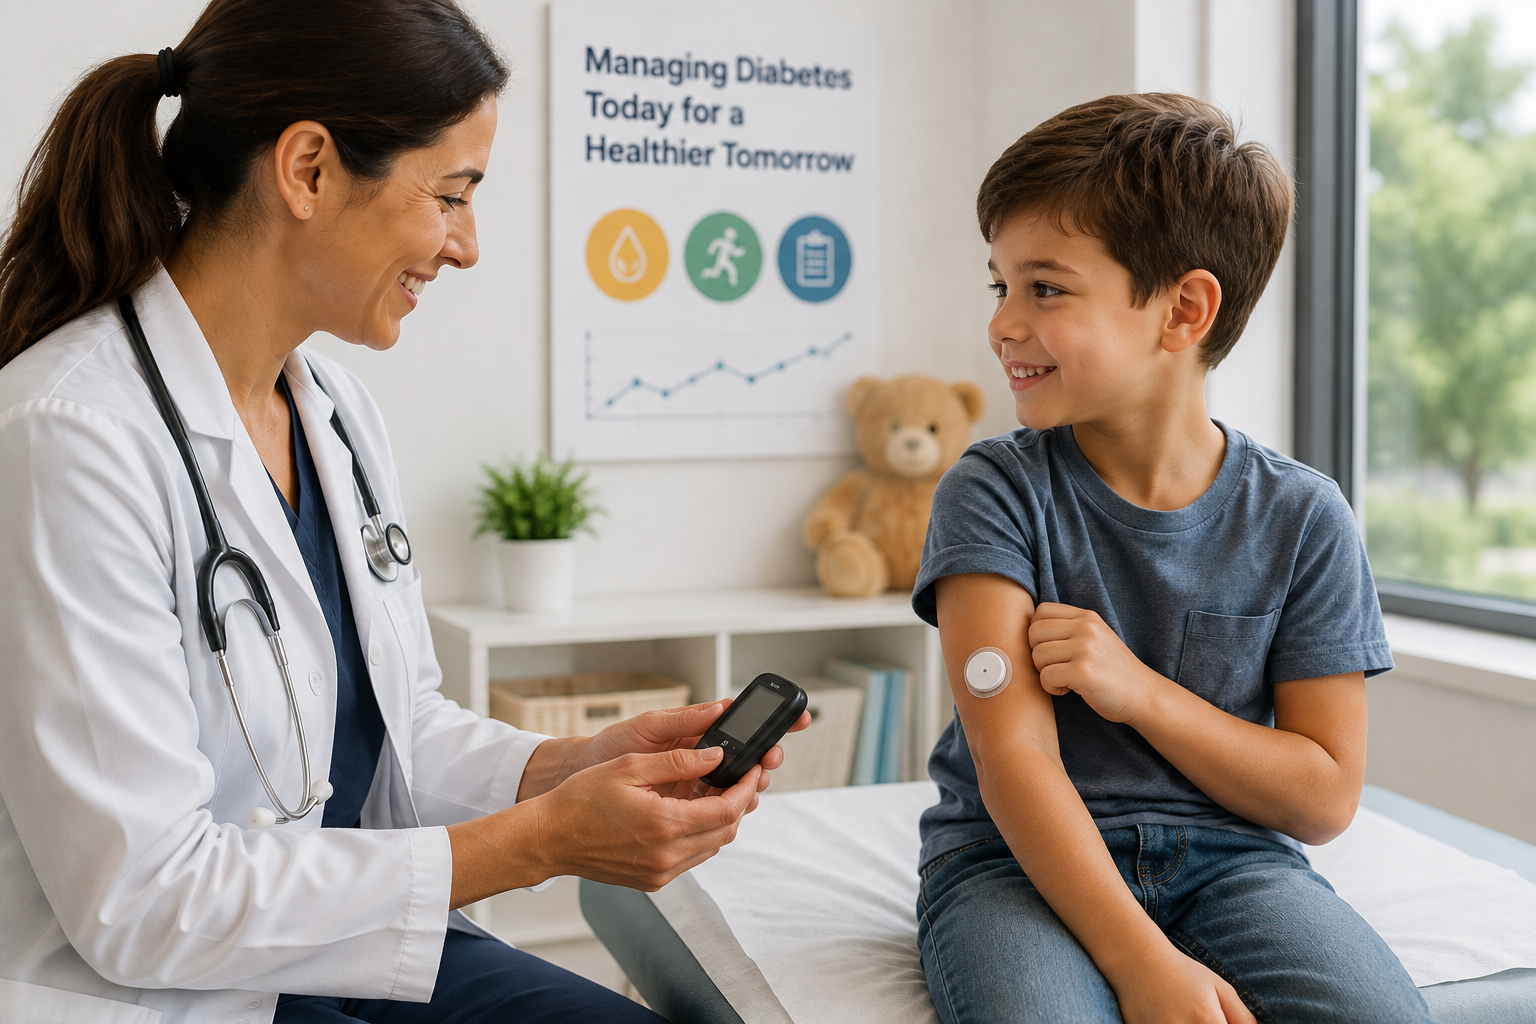
Support pediatric Type 1 diabetes screening and monitoring.

Power workforce health and preventative initiatives at scale.
Four high-value decisions
01
Identify active beta-cell injury before conventional metabolic diagnosis.
02
Identify patients with distinct levels or patterns of active biological injury.
03
Measure whether an intervention is meaningfully altering disease biology.
04
Provide developers with faster pharmacodynamic endpoints and improved trial selection.
12 / 37
The science
From healthy islet to clinical diabetes. Kihealth's diagnostics detect the earliest of these stages, inside the window where intervention still preserves function.
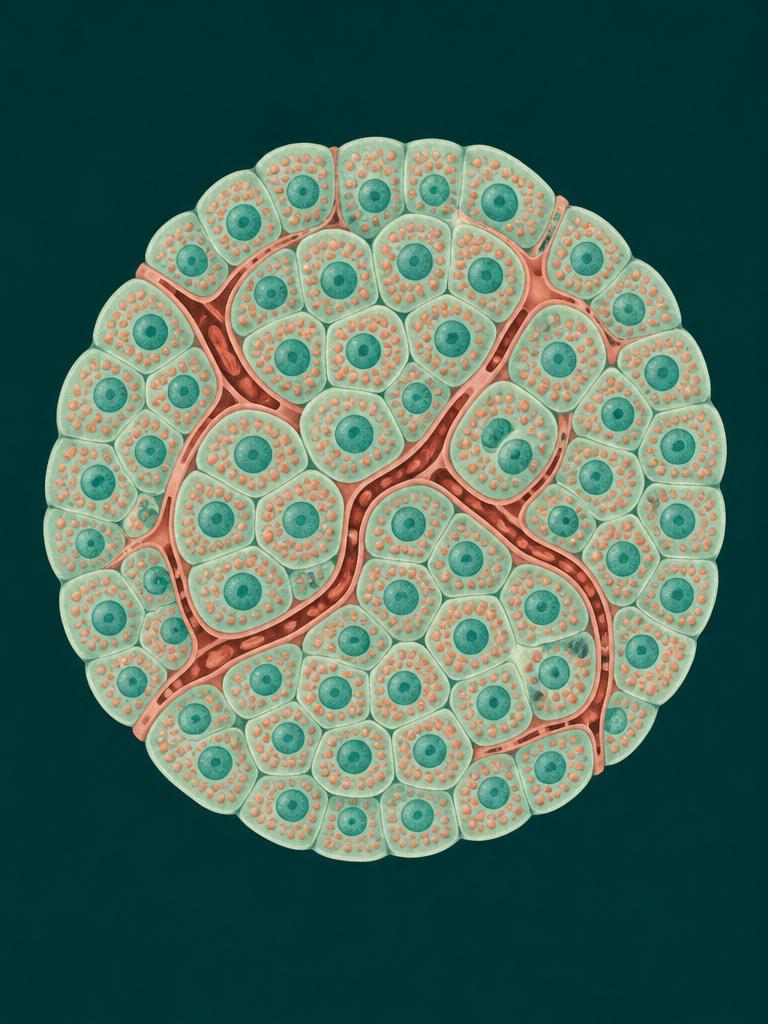 01
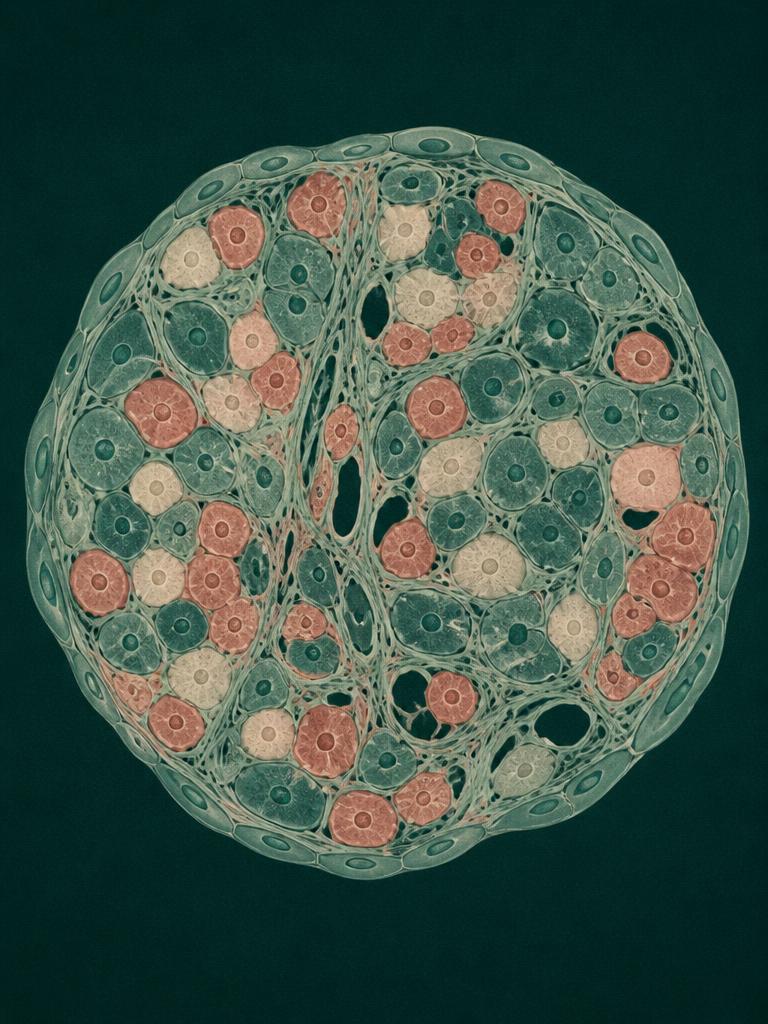
Islet β-cells maintain glucose homeostasis through tightly regulated, biphasic insulin secretion. Cellular architecture and mitochondrial function are intact.
 02
Chronic hyperglycemia, hyperlipidemia, and increased secretory demand drive endoplasmic reticulum stress and mitochondrial dysfunction within the β-cell.
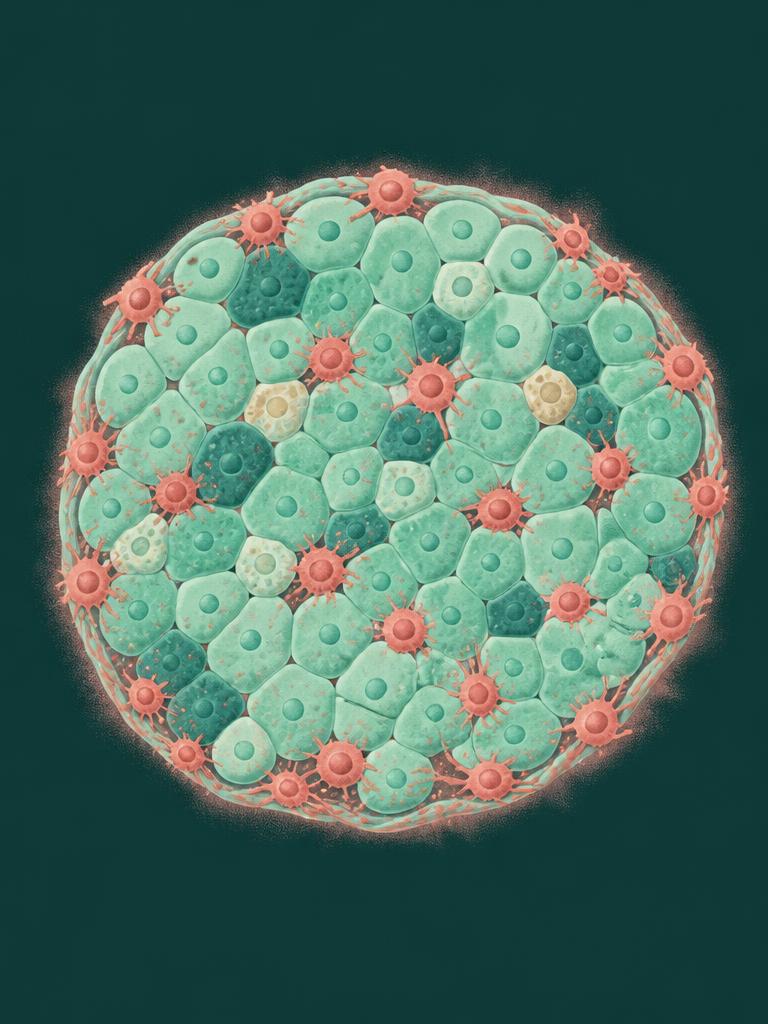 03
Islet-resident macrophages release IL-1β and TNF-α; in T1D, autoreactive T cells infiltrate the islet. Local cytokine signaling amplifies β-cell injury.
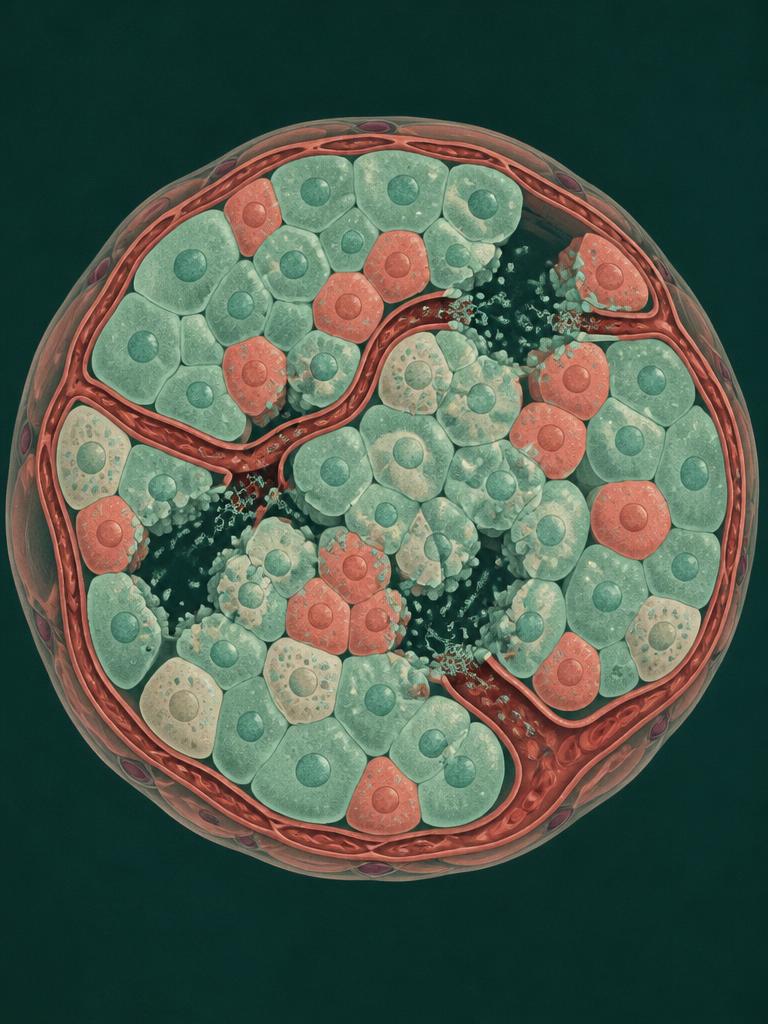 04
Injured β-cells undergo caspase-mediated programmed cell death, releasing fragmented, tissue-specific DNA into the peripheral circulation.
 05
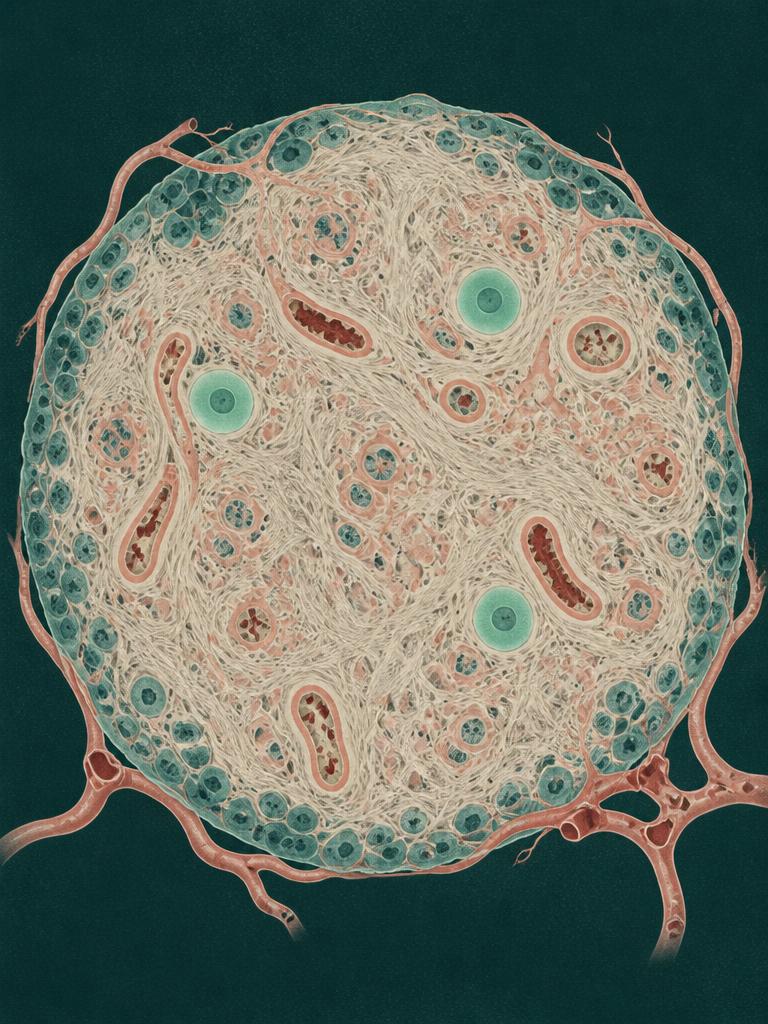
β-cell mass falls and remaining cells de-differentiate. First-phase insulin release is blunted before fasting glucose becomes abnormal.
 06
Impaired fasting glucose and impaired glucose tolerance emerge. HbA1c drifts into the 5.7–6.4% range; ~50% of β-cell function may already be lost.
 07
Clinical diagnosis by HbA1c ≥ 6.5%, fasting glucose ≥ 126 mg/dL, or symptomatic hyperglycemia. Microvascular complications have often begun.
Intercepting disease at stage 02
Kihealth measures differentially unmethylated INS cfDNA, a blood-based molecular signal associated with pancreatic beta-cell injury and death, years before conventional markers move.
Why it matters
Conventional laboratory markers describe the endpoint of the process, not its onset. By the time diabetes is diagnosable, up to 50% of functional β-cell mass may already be lost.
13 / 37
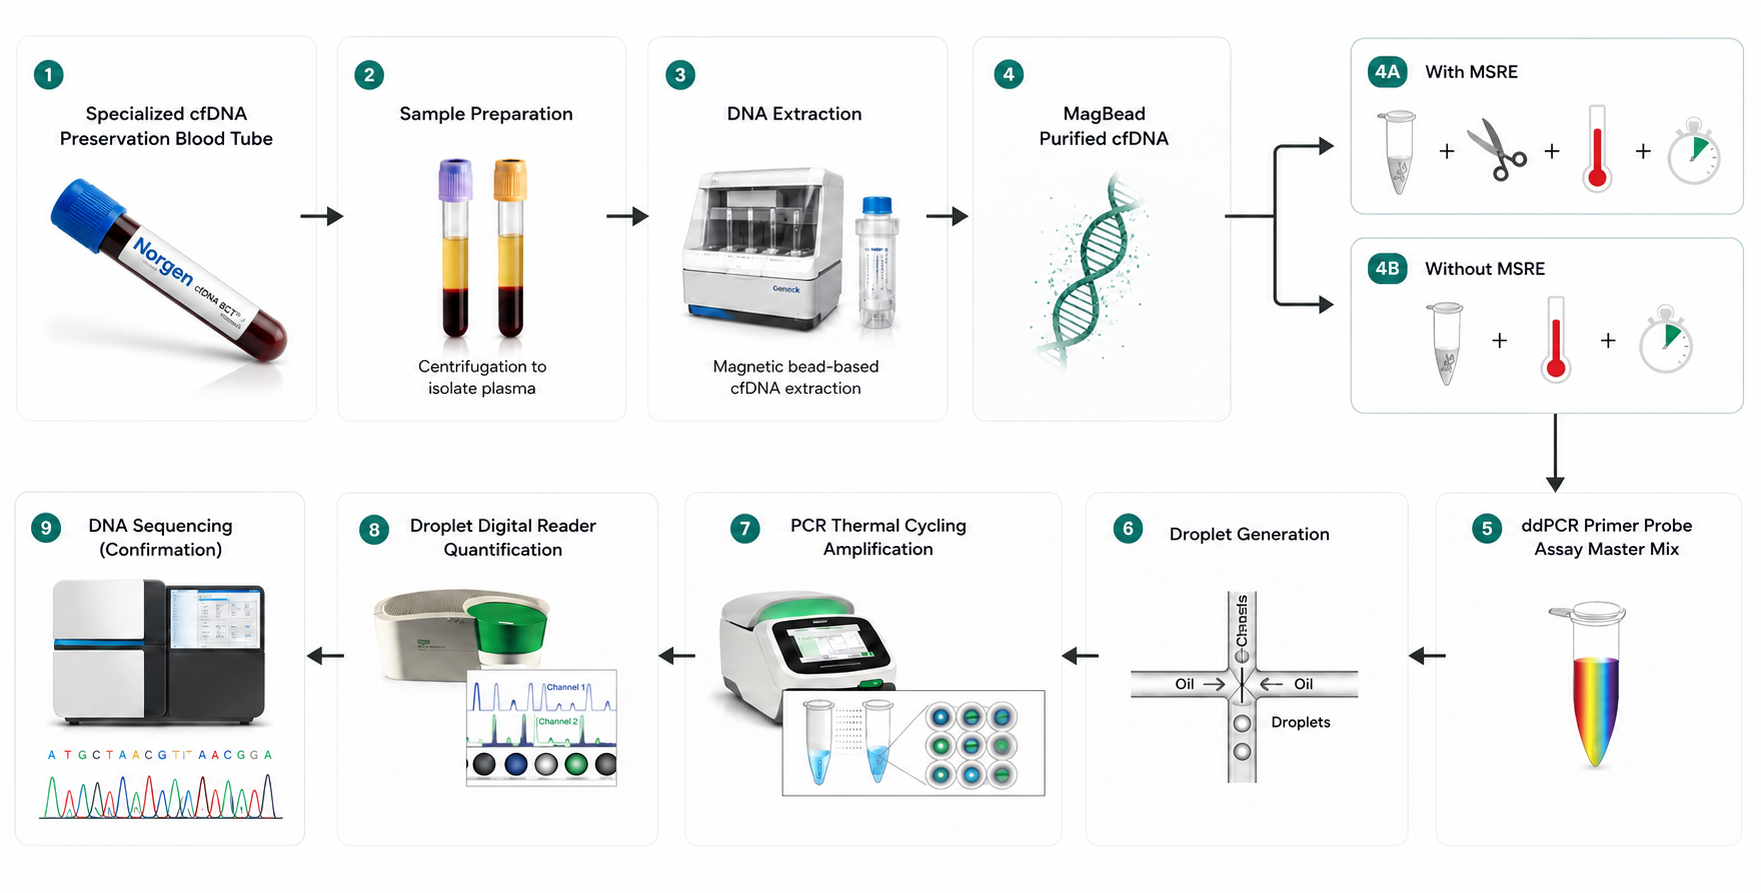
How it works
14 / 37
Analytical validation
Kihealth’s Beta Intercept assay was evaluated across eight core analytical characteristics using predefined study designs, controls and acceptance criteria. The validation program assessed whether the method could reliably, reproducibly and specifically measure differentially unmethylated INS cfDNA.
Within 20%
Results within the predefined 20% acceptance range
Measurements remained within the predefined 20% acceptance range during the five-day accuracy assessment.
CV <20%
Repeatability and reproducibility
Replicate measurements met the report’s predefined precision criteria.
R² >0.9999
Across the evaluated range
Observed copy-number measurements showed a highly linear relationship across the evaluated concentration range.
4.5 copies/µL
Analytical detection capability
Analytical detection capability is distinct from clinical sensitivity.
Target-Specific
Intended INS methylation targets
In-silico and experimental studies supported specific measurement of the intended INS methylation targets.
65.73%
Mean recovery of input DNA · 4.52% CV
The cfDNA isolation workflow demonstrated consistent recovery across the evaluated specimens.
<1%
Positive droplets in no-template control wells
Representative testing demonstrated minimal detectable carryover between high-concentration samples and no-template controls.
5 Days
Room temperature and 2–8°C
Plasma cfDNA measurements were supported through five days under the evaluated room-temperature and refrigerated conditions.
15 / 37
Proprietary Targets
Kihealth’s Beta Intercept assay combines target-specific primer-and-probe design with methylation-sensitive restriction digestion to measure three differentially methylated regions of the INS gene.
The assay measures three beta-cell-associated regions of the INS gene and uses LMO1 as an intra-chromosomal reference target.
Chromosome 11
INS gene — three evaluated regions
The methylation state of each evaluated INS restriction site determines whether the DNA fragment is preserved or cleaved during enzyme treatment.
HpaII blocked → fragment preserved
HpaII cleaves → fragment lost
LMO1 provides a chromosome 11 reference target used to support normalization across the multiplex measurement.
Quadruplex assay panel
INS −233
Measurement target
INS −135
Measurement target
INS +399
Measurement target
LMO1
Intra-chromosomal reference
LMO1 contains no evaluated HpaII site and supports normalization and quality assessment; it is not interpreted as a biological marker of beta-cell death.
16 / 37
Clinical and analytical evidence
The insulin gene locus is uniquely demethylated in pancreatic beta cells. When those cells die, locus-specific cell-free DNA is released into circulation and can be quantified in plasma.
Cell-type specificity
Signal is concentrated in beta-cell-derived material and remains below the assay cutoff in leukocyte and no-template controls. Values shown as % unmethylated INS cfDNA (relative signal).
Empirical proof
Plasma unmethylated INS cfDNA measured before and after clinical islet infusion.
Pre-infusion baseline
30 minutes
6 hours
24 hours
Acute peak captured
Approximately fivefold increase detected within 30 minutes.
Rapid plasma clearance
Signal returns toward baseline by six hours.
Real-time rather than cumulative signal
Mechanistically distinct from C-peptide.
Analytical specificity
Across all three differentially methylated INS CpG sites, the unmethylated signal is concentrated in beta-cell-derived material and is effectively absent from methylated control DNA.
INS +399
INS −135
INS −234
% unmethylated INS by sample type at each evaluated CpG site. Controls: methylated / unmethylated human gDNA, mixed methylation standards, EndoC-βH5 beta-cell DNA, synthetic gBlocks, donor-derived cfDNA. Specificity confirmed by BLAST + HpaII digestion studies.
| CpG site | EndoC-βH5 gDNA | Unmethylated gDNA | Islet Cell DNA | Buffy Coat gDNA | Methylated gDNA |
|---|---|---|---|---|---|
| INS +399 | 95.0% | 74.5% | 56.3% | 8.6% | 0.0% |
| INS −135 | 97.6% | 78.5% | 70.6% | 13.2% | 0.0% |
| INS −234 | 99.3% | 86.3% | 79.3% | 15.6% | 0.0% |
Preliminary findings are not presented as final clinical performance. Source available in data room.
17 / 37
Scientific evidence
Exploratory analysis of 11 evaluable subjects from an interventional teplizumab T1D dataset — 9 treated and 2 placebo — together with 5 healthy controls for contextual comparison.
Treatment assignment
Takeaway — Treatment exposure is associated with a lower β-cell injury signal and greater functional reserve.
Diabetes outcome
Takeaway — C-peptide reflects remaining secretory capacity, while %U provides a distinct measure of active β-cell injury.
18 / 37
The window of opportunity
Traditional biomarkers move only after substantial, irreversible β-cell loss. Kihealth detects the molecular signature of active β-cell death years earlier, inside the window where intervention still preserves function.
01 · Conventional markers stay silent
Normal
HbA1c while injury is underway
Glycemic measures reflect downstream consequence, not active beta-cell loss.
02 · WE REVEAL ACTIVE BETA-CELL DEATH
Earlier
Molecular signal of apoptosis
Demethylated INS cfDNA rises as beta cells die — a direct measurement, not an inference.
03 · Intervene while function remains
Preserve
Functional beta-cell mass
Detection inside the window creates the opportunity to act before irreversible loss.
19 / 37
Market opportunity
Beachhead opportunity
$400M+
Expansion opportunity
$12B+
Long-term platform opportunity
$86B+
A trusted network of leading institutions
Multi-center collaborations with the academic and clinical organizations defining the future of metabolic health.










20 / 37
Commercialization
Kihealth begins with paid research and therapeutic programs, then compounds evidence into clinical utility, reimbursement and recurring testing.

Phase 1
2026-2027Phase 2
2027Phase 3
2027-2028Phase 4
202821 / 37
COMMERCIAL ENTRY POINT
Help drug developers understand who is progressing, how quickly, and whether treatment is changing the underlying biology.

Contracted studies generate revenue while building the evidence for broader adoption.
01
Reveal patterns in existing trial data
Analyze banked samples against known outcomes to evaluate whether Beta Intercept distinguishes progressors from non-progressors and responders from non-responders.
Value to pharmaEvidence to sharpen patient selection and future trial design.
02
Track disease progression over time
Embed baseline and longitudinal testing alongside C-peptide and glycemia to evaluate how beta-cell injury patterns relate to disease-stage progression and its pace.
Value to pharmaBetter patient stratification and insight into when intervention may matter most.
03
Investigate early evidence of treatment response
Test whether early changes in beta-cell injury distinguish biological response from non-response and predict later preservation of beta-cell function.
Value to pharmaEarlier evidence to inform decisions about which therapeutic programs to advance.
22 / 37
First clinical market
Paid therapeutic programs can build the evidence needed for broader clinical adoption.
Pharma / Research · Initial revenue opportunity
Help drug developers understand progression and biological response.
Customers: Pharma, biotech and research sponsors
Commercial model: Contracted testing, program support and analytics
Clinical Care · Expansion through validation
Translate validated biological insight into defined care decisions.
Adoption requirements: Prospective validation, demonstrated clinical utility, defined decision pathways and reimbursement
VALUE ACROSS THERAPEUTIC DEVELOPMENT
Beta Intercept role: Trial enrichment · Patient stratification · Baseline biological activity · Pharmacodynamic research · Response characterization · Longitudinal biomarker analysis
23 / 37
Initial Market Opportunity
Management market model
$42M
~$3.69B
~$9.5B
Illustrative annual revenue target by year three of clinical commercialization
Future annual opportunity under broad clinical adoption
Worldwide annual category opportunity under broad clinical adoption
Commercial expansion line
Expand through clinical evidence, specialty-channel adoption and geographic access.
24 / 37
Commercial strategy
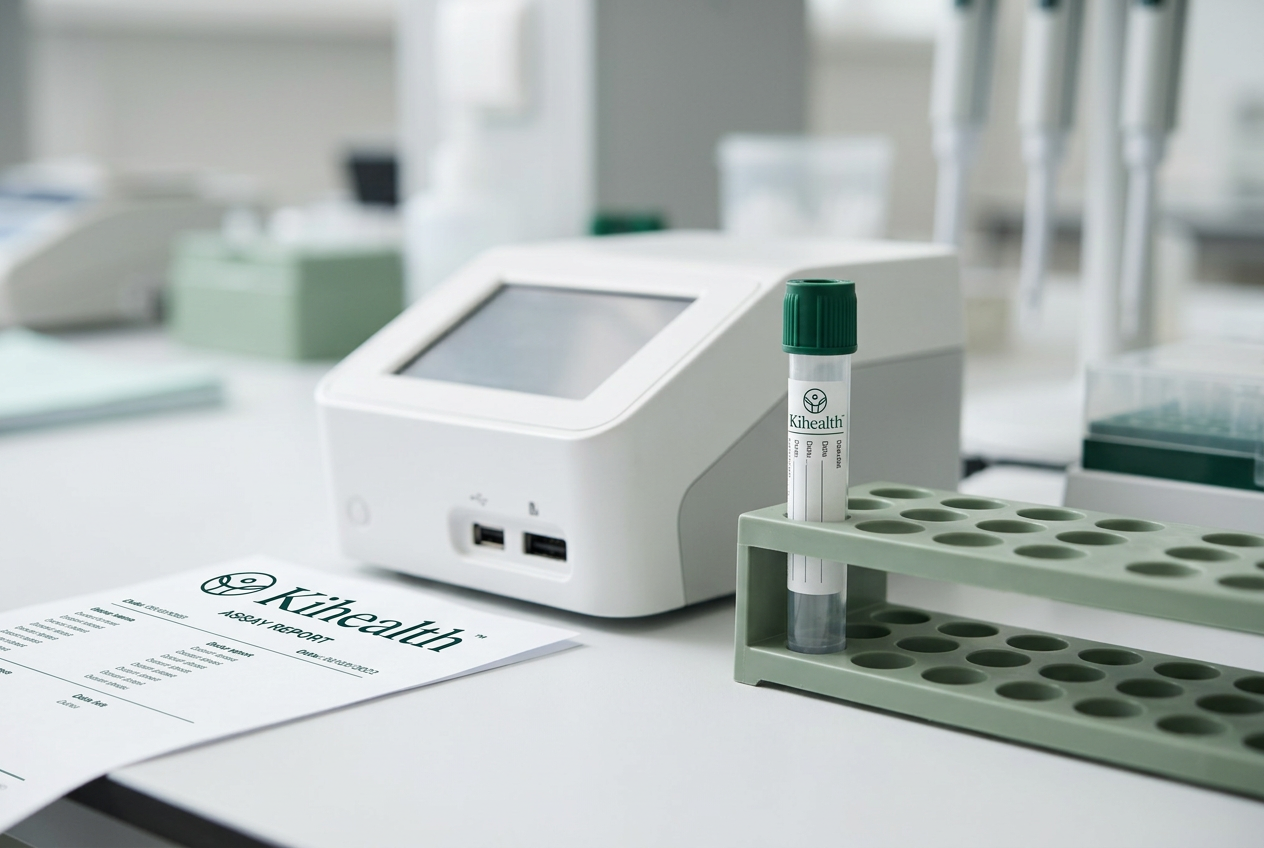
Pharma-funded studies generate initial revenue and evidence for focused adoption in specialty endocrinology.
Initial commercial focus
Pharma programs studying beta-cell preservation, supported by pediatric and adult endocrinology centers evaluating early T1D and therapeutic response.
Months 1–3
A test ready for operational deployment

Months 4–6
Pharma-sponsored testing and evidence generation

Months 7–12
Integration into clinical workflows and recurring use
12+
Active specialty ordering sites
1+
Contracted, funded pharma program
1
Prospective utility study enrolling
≥35%
Six-month repeat-test completion among eligible patients
Commercial economics
$500 modeled net revenue per test70% gross-margin target, subject to cost validation
Expansion gateBroader distribution follows evidence of clinical utility, repeat demand and sustainable unit economics.
25 / 37
Market opportunity
Revenue today, a recurring clinical market next, and platform expansion beyond.
Pharma Entry
Evaluate active beta-cell injury in studies of disease progression, beta-cell preservation and therapeutic response.
Strategic value
Generate revenue and clinical datasets before broad clinical reimbursement.
T1D Clinical Adoption
Extend Beta Intercept into specialty care for longitudinal assessment of beta-cell injury as disease and treatment response evolve.
Expansion gate
Prospective validation, demonstrated clinical utility and a viable payment pathway.
T2D Platform Expansion
Develop applications in T2D and metabolic disease, followed by additional tissue-specific injury assays.
Expansion gate
Indication-specific validation and demonstrated customer demand.
26 / 37
Second platform application
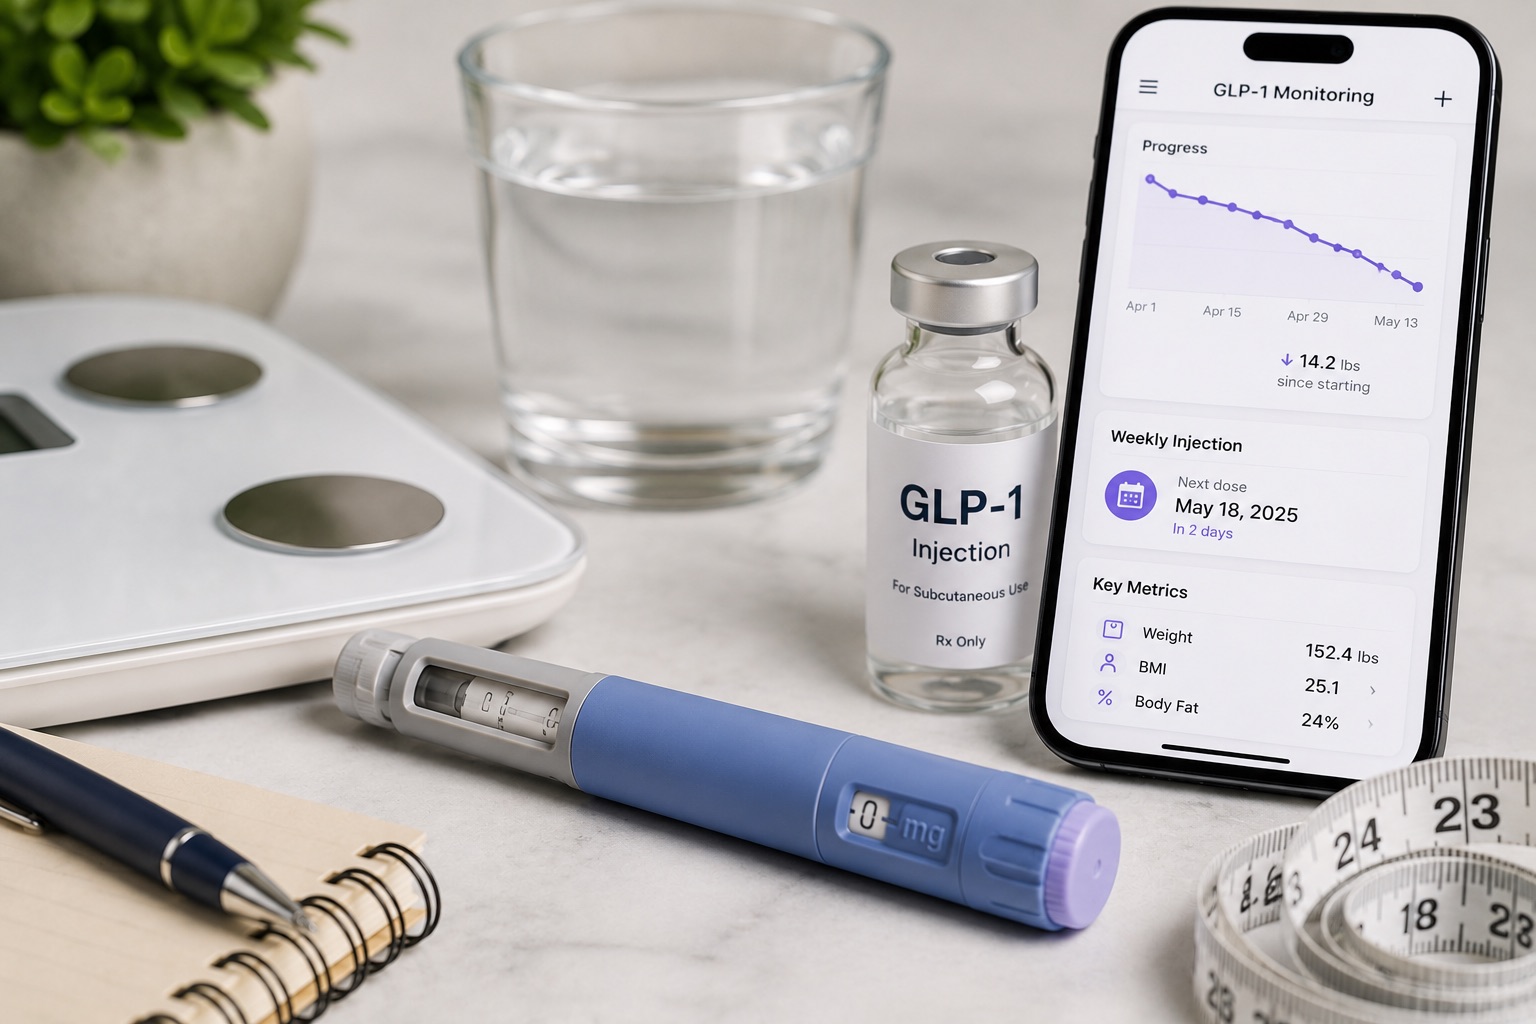
GLP-1 / incretin therapy monitoring
The Scale
589M
Global
Adults worldwide living with diabetes in 2024. Type 2 accounts for more than 90% of diabetes cases. (IDF Diabetes Atlas, 2025)
115.2M
United States
U.S. adults with prediabetes, representing a substantial population at elevated risk of T2D. (CDC, 2026)
The Therapeutic Market
$114B
Projected global obesity-drug sales by 2030
Goldman Sachs Research
$200B
Projected global incretin market by 2030
J.P. Morgan Global Research
Beta Intercept does not need to capture the therapeutic dollar. It can become part of the measurement infrastructure surrounding it.
The Measurement
Opportunity
Molecular visibility into beta-cell injury is designed to complement established metabolic & functional assessments with a tissue-specific signal of cellular injury.
The Pathway
Initial Entry — Pharma Research
Evaluate whether baseline injury and changes over time improve patient stratification and reveal differences in therapeutic response.
Priority studies include GLP-1 / incretin therapies, metformin, bariatric procedures and lifestyle interventions.
Commercial model
Sponsored studies, serial testing and analytics
Clinical Expansion — Progression & Monitoring
Evaluate whether serial injury measurements distinguish progressors from non-progressors and improve assessment of disease trajectory.
Potential use spans defined prediabetes-risk populations, early T2D and longitudinal treatment monitoring.
Commercial model
Repeat testing in validated clinical populations
The Evidence Gate
Detect presymptomatic T2D
Beta-cell death predates hyperglycemia and a rise in A1c, so active injury can be measured before glucose-based detection.
Monitor GLP-1 and incretin therapies
Assess whether serial measurements reflect treatment effect on beta-cell injury as therapeutic response evolves.
Establish clinical risk factors
Evaluate added predictive value beyond A1c, glucose / CGM, weight, insulin / C-peptide and established clinical risk factors.
27 / 37
Second market opportunity
Management market model
~$315M
annually
~$30.9B
annually
~$317.4B
annually
~630,000 monitored patients
Illustrative 2% adoption across 31.48M U.S. adults with impaired glucose tolerance.
31.48M × 2% × 1 test annually × $500
61.85M adults with impaired glucose tolerance
31.48M U.S. + 30.37M EU27
61.85M × 1 test annually × $500
634.77M adults with impaired glucose tolerance
634.77M × 1 test annually × $500
The Opportunity
Add biological insight to established metabolic testing — supporting the development of more informed prevention and intervention strategies.
28 / 37
Commercial strategy
A focused 12-month program to establish clinical relevance, paid demand and repeat use.

Adult endocrinology + academic centers
Up to four specialty pilot programs
Selective distribution, measurable economics
Year-one targets
Up to 4
pilot programs
8–12
ordering specialty sites
1
prospective utility study enrolling
≥25%
six-month retesting among patients eligible and due for follow-up
29 / 37
Platform expansion
The same platform architecture applies across multi-billion dollar indications.
Type 1 diabetes
Early autoimmune beta-cell injury detection for earlier identification, monitoring, and intervention in Type 1 diabetes.
Type 2 diabetes · GLP-1
Beta-cell dysfunction detection and GLP-1 therapy monitoring across metabolic disease and Type 2 diabetes.

Kihealth
Intercept IQ™
Pancreatic & oncology
Early cancer detection beginning with pancreatic cancer, with a growing future oncology pipeline.
Neurodegeneration
Alzheimer's disease and broader CNS biomarker detection — future neurodegenerative applications.
The Intercept IQ™ platform
A unified molecular intelligence platform that integrates complementary biomarkers to detect disease earlier, improve diagnostic accuracy, and enable precision medicine.
30 / 37
The AI intelligence backbone
Molecular Signals. An Evolving View of the Individual.
Kihealth’s molecular AI engine, developed to interpret tissue-specific measurements, analyze biological change and support predictive modeling.

From measurement to intelligence

Tissue-specific molecular and genetic measurements
The AI layer of Intercept IQ™ · Longitudinal modeling · Molecular Digital Twin
Disease activity · Progression patterns · Therapeutic response
The Molecular Digital Twin
Serial measurements update the model over time, connecting a patient’s baseline biology with changes observed during disease progression and intervention.
Understand activity
Interpret molecular signals associated with tissue injury.
Track change
Compare new measurements with the individual’s biological history.
Model trajectories
Investigate progression risk and patterns of therapeutic response.
31 / 37
Traction
Kihealth is not a concept — execution is already underway.

Automated low-abundance extraction workflow.
Yale · Nemours · CHOC · Mayo Clinic · Children's Diabetes Foundation.
Issued patents on core cfDNA methylation methodology.
DTC and physician channels — no debt on the cap table.
PLA pathway active with cfDNA ADLT pricing anchors.
32 / 37
Business model
Projected annual revenue
The growth thesis
Annual testing targets grow from 5,000 tests in 2027 to 182,000 in 2031. Population and payer programs begin in 2030, adding $3.3M in 2030 and $17.08M in 2031. Total 2031 revenue is $89.68M: $22.5M T1D, $46.5M T2D/IGT, $3.6M pharma and $17.08M population and payer programs.
Clinical testing: $500 per test. Pharma testing: provisional $300 per test, pending confirmation. T1D uses two annual tests per patient; T2D/IGT uses one. All figures are in US dollars.
| Operating driver | 2027 | 2028 | 2029 | 2030 | 2031 |
|---|---|---|---|---|---|
| T1D monitored patients | 700 | 3,000 | 6,000 | 12,000 | 22,500 |
| T1D annual tests · 2 per patient | 1,400 | 6,000 | 12,000 | 24,000 | 45,000 |
| T2D IGT monitored patients | 3,000 | 12,200 | 24,400 | 48,800 | 93,000 |
| T2D annual tests · 1 per patient | 3,000 | 12,200 | 24,400 | 48,800 | 93,000 |
| Annual pharma tests delivered | 600 | 1,800 | 3,600 | 7,200 | 12,000 |
| Population and payer-program tests | 0 | 0 | 0 | 6,000 | 32,000 |
| Total annual tests | 5,000 | 20,000 | 40,000 | 86,000 | 182,000 |
| Revenue stream | 2027 | 2028 | 2029 | 2030 | 2031 |
|---|---|---|---|---|---|
| T1D testing | 0.7 | 3 | 6 | 12 | 22.5 |
| T2D/IGT testing | 1.5 | 6.1 | 12.2 | 24.4 | 46.5 |
| Pharma testing | 0.18 | 0.54 | 1.08 | 2.16 | 3.6 |
| Population and payer programs | 0 | 0 | 0 | 3.3 | 17.08 |
| Total modeled revenue | 2.38 | 9.64 | 19.28 | 41.86 | 89.68 |
| Operating driver | 2030 | 2031 |
|---|---|---|
| Targeted screening programs | 4 | 8 |
| Patients screened per program | 1,000 | 2,500 |
| Screening tests · 1 per patient | 4,000 | 20,000 |
| Therapy optimization programs | 2 | 4 |
| Monitored patients per program | 500 | 1,500 |
| Therapy optimization tests · 2 per patient | 2,000 | 12,000 |
| Total payer-program tests | 6,000 | 32,000 |
| Annual service fee per screening/therapy program | $50,000 | $50,000 |
| Population-health analytics contracts | 0 | 2 |
| Total covered members across analytics contracts | 0 | 40,000 |
| Billable months | 0 | 6 |
| Fee per member per month | — | $2 |
| Revenue component | 2030 | 2031 |
|---|---|---|
| Targeted screening · $500/test | $2,000,000 | $10,000,000 |
| Therapy optimization · $500/test | $1,000,000 | $6,000,000 |
| Program service fees | $300,000 | $600,000 |
| Population-health analytics fees | $0 | $480,000 |
| Shared savings or performance bonuses | $0 | $0 |
| Total channel revenue | $3,300,000 | $17,080,000 |
Alternative pricing. If every test, including pharma, is priced at $500, annual revenue including unchanged payer program and analytics fees is $2.5M, $10.0M, $20.0M, $43.3M, $92.08M, respectively.
Model basis. Volume-driven management targets, not validated demand. Assumes all modeled tests are completed within the stated year and full prices are realized. Net revenue must reflect any discounts, payer allowances and uncollected amounts. Costs and profitability are not modeled.
Population and payer revenue includes screening and therapy tests, annual service fees per program and analytics fees based on total covered members across contracts. Payer volumes are additional to clinical testing; shared savings and performance bonuses are zero. Licensing, milestone payments and other analytics fees are excluded. SOM, SAM and TAM are market-size scenarios, not additions to this volume-driven forecast.
This forecast doesn't account for any pipeline development products in oncology or neurodegenerative diseases.
33 / 37
Regulatory and development roadmap
01
Current foundation
02
Near-term milestones
2027
03
Longer-term milestones
2028
34 / 37
Leadership

Chief Executive Officer
Translates Kihealth’s scientific advantage into an executable growth strategy.

Chief Operating Officer
Builds the operating and partnership infrastructure required to scale Kihealth.

Chief Medical Officer
Board-certified pediatric endocrinologist and diabetes specialist leading clinical strategy.

Chief Scientific Officer
Molecular biologist and diagnostics innovator leading biomarker discovery.

SVP, Business Development
Leads commercial partnerships and business development across clinical.
Scientific & clinical advisors

Professor of Immunobiology & Medicine, Yale School of Medicine
World-leading authority in Type 1 diabetes prevention and immunotherapy, central to the development of teplizumab and to the foundational science underpinning Kihealth's platform.

Director Emeritus, Diabetes Research Institute, University of Miami
Internationally renowned physician-scientist and pioneer in diabetes research, regenerative medicine and cellular transplantation.

Director of Business Development, Harvard University
Dual focus on scientific innovation and biotechnology business strategy, advising on translational programs and partnership development.

Chief of Pediatric Endocrinology, Nemours Children's Health
More than 34 years in pediatric endocrinology and clinical research, with a focus on integrating novel diagnostics into routine care pathways.

Endocrinologist, Cedars-Sinai Medical Center
Board-certified endocrinologist combining evidence-based care with advances in precision metabolic medicine.
35 / 37
The Investment
$15 million Series A
24 months to inflection
Use of funds
Expand paid pharma programs
Retrospective trial analysis, prospective therapeutic studies, and longitudinal biomarker services.
Establish incremental value
Does Beta Intercept predict progression or response beyond C-peptide, HbA1c and conventional measures?
Validate clinical utility
Define the patient, the testing cadence, and the clinical decision — demonstrate that the result changes management.
Advance regulatory + reimbursement
Generate evidence supporting the intended use and payment pathway.
Expand the platform
T2D / metabolic intervention studies and a second tissue-specific indication.
Allocation and milestone timing are operating targets, not guaranteed outcomes, and are subject to execution, regulatory processes and market conditions.
36 / 37

Closing
Kihealth is developing molecular tests and AI to reveal active tissue injury and track biological change, with the goal of informing intervention earlier in the disease process.
Who we serve
Earlier Insight. More Informed Decisions. Greater Potential Impact.
Identify patients who may benefit from earlier intervention—and track biological response to guide more personalized care.
Improve trial selection, distinguish progressors from non-progressors, and evaluate early signals of therapeutic response.
Generate evidence to target effective care, assess treatment value, and evaluate the potential to reduce costly disease progression.
Gain earlier insight into disease activity—and a clearer path to timely, personalized intervention.
Our ambition: make earlier molecular insight a foundation for disease prevention.
The Series A is designed to advance a validated lead application, expand commercial and pharmaceutical adoption and establish the foundation for a multi-indication disease-interception platform.
01
Work through the full thesis from the top.
02
Approved presentations, financials and scientific materials.
03
Confidential materials are available following execution of an NDA.
04
Arrange time with the Kihealth management team.
37 / 37

Purpose and investment risk
This presentation provides an overview of Kihealth and does not contain all information necessary to evaluate an investment. Any investment should be evaluated together with definitive offering documents and applicable risk disclosures. An investment involves substantial risk, including illiquidity, dilution and possible loss of the entire investment.
Forward-looking statements and projections
Statements regarding future revenue, market penetration, clinical development, regulatory milestones, reimbursement, partnerships and commercialization reflect management’s current expectations and assumptions as of the presentation date. Actual results may differ materially due to clinical outcomes, regulatory requirements, adoption, competition, financing needs and other risks. Financial projections and illustrative program economics are estimates, not guaranteed results or contracted revenue unless expressly identified.
Market opportunity
Market estimates combine third-party information and management assumptions concerning patient populations, eligibility, testing frequency, pricing and adoption. Population prevalence does not establish clinical eligibility or achievable demand. Market size estimates do not represent expected company revenue.
Clinical and regulatory development
Potential applications described for Beta Intercept™, Intercept IQ™ and Ki Intelligence are subject to the validation and regulatory requirements applicable to each intended use. Exploratory findings do not establish clinical utility or guarantee future performance. Laboratory certification, accreditation, coding and FDA pre-submission activities do not themselves establish FDA marketing authorization or reimbursement coverage.